Deeper application insights at lower costs
Authors: Suzanne Slaughter, Bharath Sitaraman

Build what you want, how you want, accessing the most value at fair, transparent prices.
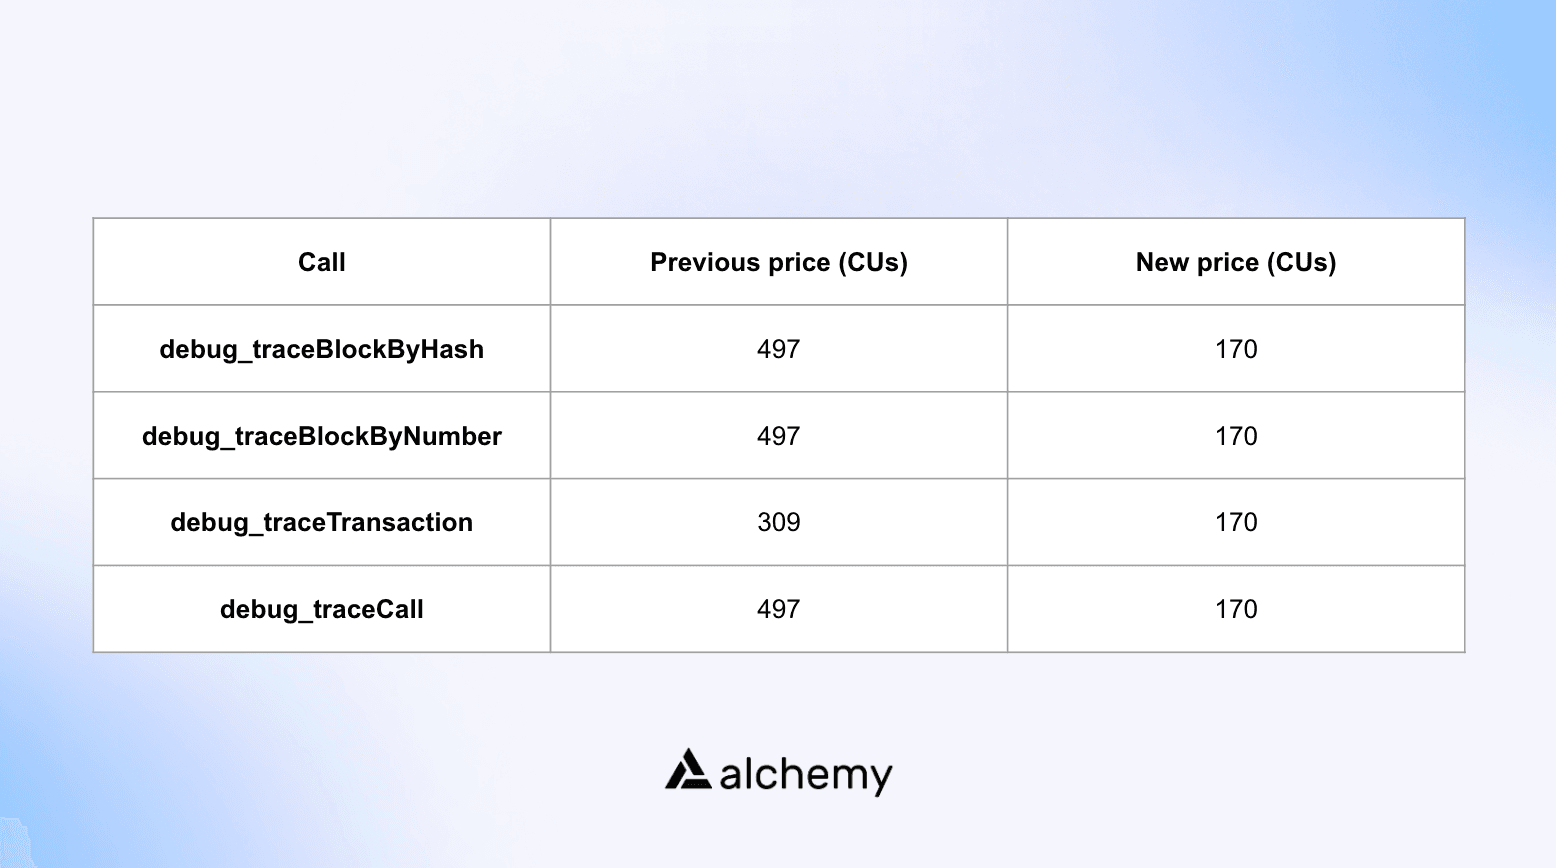
That’s why, after listening to your feedback, we’ve reduced the Compute Unit (CU) cost of four critical debug\_trace methods, giving you a more cost-effective solution for gathering comprehensive transaction execution details.
debug\_trace methods are important for debugging, troubleshooting, and understanding why a contract behaved in a certain way.
By re-architecting back end infrastructure, Alchemy has been able to pass up to 3x efficiency savings to you for four key debug\_trace methods:
**debug\_traceBlockByHash****debug\_traceBlockByNumber****debug\_traceTransaction****debug\_traceCall**

In practice, the reduction in CUs means you can access massive value and important insights at significantly reduced cost.
Ready? Get started with debug\_trace methods today.
Remind me, what’s a compute unit (cu)?
Compute Units (CUs) measure total computational resources apps use when making requests on Alchemy, taking into account the fact that some queries are lightweight and fast to run (e.g., eth\_blockNumber) while others are more intense (e.g., eth\_getLogs).
To that end, each method is assigned a quantity of CUs. You are charged based on the resources your application actually uses, rather than a flat fee per request. In this sense, CUs work like gas on mainnet, where the fee is correlated with a transaction’s execution.
More to come on how to think about CUs within the broader marketplace.
Digging into **debug\_trace**
The substantial decrease in CUs for debug\_trace makes all of these calls considerably more affordable to use, enabling you to explore transaction execution at a granular level.
Why does this level of detail matter?
It’s simple: The downside of contract execution is that it is very hard to tell what a transaction actually did.
Existing methods to get transaction receipts, like eth\_getTransactionReceipt, while useful, lack granularity at the transaction execution level.
When you’re trying to iron out a bug, this means that while some information can be gleaned, much more data is missing.
By contrast, debug\_trace methods capture a breakdown of what happens during a transaction's execution, a critical unlock for builders. These methods capture the intricate details of smart contract interactions, such as:
- The sequence of calls made between contracts
- The data passed and modified during those calls
- The gas usage at each step
- The success or failure status of individual actions
At this level of granularity, you can troubleshoot, look for efficiencies, and better understand your app.
Who will benefit from this cost reduction?
You! 😁
More affordable **debug\_trace** methods are super important across all Web3 verticals:
- Wallet builders: Get deeper insights into transaction processing and user interactions within your wallet.
- Analytics platforms: Detailed transaction data for more accurate and valuable insights into users.
- Marketplaces: Get a better sense of transaction flow to enhance security, help you track activity, and lead to optimized platform operations.
- Any app developer: Whatever you’re building,
debug\_tracemethods provide the best insights to build a killer, unbuggy app.
So what are you waiting for?
Thousands of developers and teams are already building with Alchemy. In fact, if you’ve used any web3 app, you’ve probably used Alchemy.
What to learn more? Dive into the docs today.
Alchemy Newsletter
Be the first to know about releases
Sign up for our newsletter
Get the latest product updates and resources from Alchemy
By entering your email address, you agree to receive our marketing communications and product updates. You acknowledge that Alchemy processes the information we receive in accordance with our Privacy Notice. You can unsubscribe anytime.
Related articles

Inside Cortex: the engineering behind sub-50ms, 99.995% uptime infrastructure
Reliable blockchain connectivity is non-negotiable. Cortex achieves sub-50ms response times and 99.995% uptime at scale through purpose-built architecture: from bare-metal hardware to an AI-managed node fleet.

Zero fees, infinite complexity: building gasless transactions at scale
Consumer apps need blockchain to feel like any other payment experience. The biggest obstacle is a fee layer most users will never understand. Here's how we remove it entirely.

Inside Alchemy's enterprise-grade security infrastructure
When enterprises evaluate blockchain providers, security is paramount. Here's how our security team—built from experts at major banks, federal agencies, and leading cloud providers—delivers infrastructure that meets enterprise standards.